2019
2014
andreaferretti/paths-js · GitHub
This library helps generating SVG paths with a high level API. These paths can be then used together with a template engine such as Mustache or Handlebars to display SVG graphics in the browser. If instead of a static template engine, you use a data binding library, such as Ractive.js, Angular or Facebook React, you get animated graphics for free.
2013
Highcharts - Interactive JavaScript charts for your webpage
Highcharts is a charting library written in pure HTML5/JavaScript, offering intuitive, interactive charts to your web site or web application. Highcharts currently supports line, spline, area, areaspline, column, bar, pie, scatter, angular gauges, arearange, areasplinerange, columnrange, bubble, box plot, error bars, funnel, waterfall and polar chart types.
2012

sigma.js | a lightweight JavaScript graph drawing library
An open-source lightweight JavaScript library to draw graphs, using the HTML canvas element

Morris.js
Morris.js is a lightweight library that uses jQuery and Raphaël to make drawing time-series graphs easy.

graphene
Graphene is a realtime dashboard & graphing toolkit based on D3 and Backbone.

shutterstock.github.com/rickshaw/
A javascript library for creating interactive realtime graphs.
2011
Highcharts - Interactive JavaScript charts for your webpage
A js graphical library for drawing charts. It stands on top of jQuery, MooTools or Prototyp, depending on the host project fundations, and provides a large serie of nice colored animated charts.
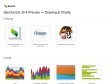
Drawing & Charts | Sencha Ext JS 4 Preview
An extjs library, which allows drawing and creating charts in a rather easy programmting way.
2010
2008

2007

PlotKit - Javascript Chart Plotting | liquidx
support for HTML Canvas and also SVG
1
(12 marks)

