2010
jQuery Sparklines
"This jQuery plugin generates sparklines (small inline charts) directly in the browser using data supplied either inline in the HTML, or via javascript. "
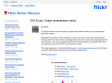
ShowSlow
"Show Slow is an open source tool that helps monitor various website performance metrics over time. It captures the results of YSlow and Page Speed rankings and graphs them"
Les allemands abandonnent IE au profit de Firefox
« Looking at the chart below, we can see that over the past few days there has been a huge increase in the number of Firefox downloads from IE users in Germany. » Et en France ?
CSScharts - bar charts created with pure CSS
For a project I am working on right now I needed to have really fast bar charts that don't need any plugins or rely heavily on JavaScript. This is why I've put together some bar charts in pure CSS.
2009

2008
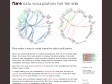
Flare | Data Visualization for the Web
by 10 othersFlare is an ActionScript library for creating visualizations that run in the Adobe Flash Player. From basic charts and graphs to complex interactive graphics, the toolkit supports data management, visual encoding, animation, and interaction techniques. Even better, flare features a modular design that lets developers create customized visualization techniques without having to reinvent the wheel.
jQuery Sparklines
This jQuery plugin generates sparklines (small inline charts) directly in the browser using data supplied either inline in the HTML, or via javascript.
Extra Stats | Build Last.fm: Extend your Last.fm experience
Last.fm Extra Stats is a windows program that calculates many cool stats using your last.fm music listening history.
2007
amCharts: customizable flash Pie & Donut chart
by 8 others
Pie & Donut chart is very universal and fully configurable flash chart. Using it you can easily have good looking, animated pies or donuts on your web site.
2006
GM Script: Graph photostream views
A Greasemonkey script to display a graph of the number of times your photostream has been viewed
2005
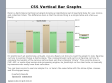
CSS Vertical Bar Graphs
Here's a fairly typical vertical bar graph showing a hypothetical set of quarterly data for, say, invoice and collection totals. The difference here is that the whole thing is a simple table and a few divs. Really.
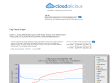
Cloudalicious - Watching Tag Clouds Over Time
Amusant de voir comment le tag "ajax" s'est installé doucement mais surement...

.net Charting Home
.netCHARTING enables your web site to display massive amounts of dynamically generated data quickly and easily through a visual interface. Built with 100% managed code using C# with samples provided in both C# and VB.NET, this high performance charting control also contains a feature rich data access and aggregation system with calculation support.


Drapeaux de Charung Gollar (diplomate norvégien)
by 3 othersUne fabuleuse idée d'utilisation des drapeaux comme graphes statistiques


1
(19 marks)
